이전 글
Kaggle Courses - Basic Data Exploration
Selecting Data for Modeling
먼저 다음과 같은 데이터를 가져온다 해보자.
import pandas as pd

melbourne_file_path = '../input/melbourne-housing-snapshot/melb_data.csv'
melbourne_data = pd.read_csv(melbourne_file_path)
melbourne_data.columns
Out[1]:
Index(['Suburb', 'Address', 'Rooms', 'Type', 'Price', 'Method', 'SellerG',
       'Date', 'Distance', 'Postcode', 'Bedroom2', 'Bathroom', 'Car',
       'Landsize', 'BuildingArea', 'YearBuilt', 'CouncilArea', 'Lattitude',
       'Longtitude', 'Regionname', 'Propertycount'],
      dtype='object')
# The Melbourne data has some missing values (some houses for which some variables weren't recorded.)
# We'll learn to handle missing values in a later tutorial.
# Your Iowa data doesn't have missing values in the columns you use.
# So we will take the simplest option for now, and drop houses from our data.
# Don't worry about this much for now, though the code is:

# dropna drops missing values (think of na as "not available")
melbourne_data = melbourne_data.dropna(axis=0)
여기서 데이터의 서브셋을 선택하는 방법은 많으나, 먼저 다음 두 가지를 살펴보자.
- “prediction target”을 선택한다.
- “features”을 선택한다.
Selecting The Prediction Target
dot-notation (점 표기법)을 통해 prediction target을 선택할 수 있다. 이러한 single coulmn은 Series에 저장된다. dot-notation을 통해 예측하고자 하는 열을 선택하며, 이를 prediction target이라고 한다. 관행적으로 prediction target을 y라고 한다.
y = melbourne_data.Price
Choosing “Features”
모델에 입력되고 나중에 예측되는데 사용되는 column을 “Features”라고 한다. 이 글의 경우, 주택 가격을 결정되는데 사용하는 열이 될 것이다.
다음과 같은 예시로 여러 features를 선택할 수 있다.
melbourne_features = ['Rooms', 'Bathroom', 'Landsize', 'Lattitude', 'Longtitude']
관행적으로 이러한 데이터는 x라고 한다.
X = melbourne_data[melbourne_features]
Building Your Model
scikit-learn 라이브러리를 통해 모델을 만들 수 있다. 이 라이브러리는 sklearn으로 사용된다.
모델을 구축하는 단계는 다음과 같다.
- Define: 어떤 타입의 모델이 사용될 것인지 정의한다.
- Fit: 데이터의 패턴을 읽고 학습시킨다. 가장 핵심적인 부분이다.
- Predict: 결과를 예측한다.
- Evaluate: 모델의 예측의 정확성을 측정한다.
from sklearn.tree import DecisionTreeRegressor

# Define model. Specify a number for random_state to ensure same results each run
melbourne_model = DecisionTreeRegressor(random_state=1)

# Fit model
melbourne_model.fit(X, y)
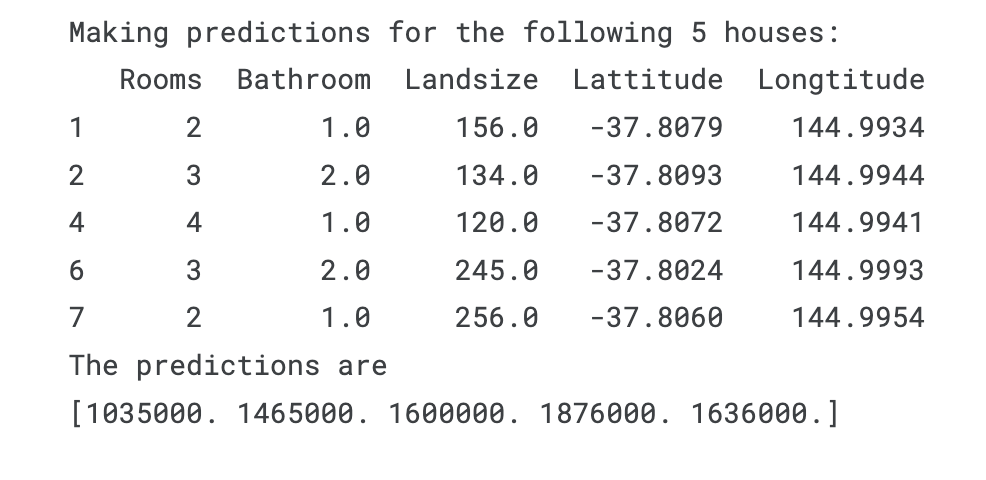
이제 예측 가능한 모델이 생겼다.
print("Making predictions for the following 5 houses:")
print(X.head())
print("The predictions are")
print(melbourne_model.predict(X.head()))

Execises
Step 1: Specify Prediction Target
Select the target variable, which corresponds to the sales price. Save this to a new variable called y. You’ll need to print a list of the columns to find the name of the column you need.
# print the list of columns in the dataset to find the name of the prediction target
y = ____

# Check your answer
step_1.check()
정답
home_data.describe()
y = home_data.SalePrice

# Check your answer
step_1.check()
Step 2: Create X
Now you will create a DataFrame called X holding the predictive features.
Since you want only some columns from the original data, you’ll first create a list with the names of the columns you want in X.
You’ll use just the following columns in the list (you can copy and paste the whole list to save some typing, though you’ll still need to add quotes):
- LotArea
- YearBuilt
- 1stFlrSF
- 2ndFlrSF
- FullBath
- BedroomAbvGr
- TotRmsAbvGrd
After you’ve created that list of features, use it to create the DataFrame that you’ll use to fit the model.
# Create the list of features below
feature_names = ___

# Select data corresponding to features in feature_names
X = ____

# Check your answer
step_2.check()
정답
# Create the list of features below
feature_names = ['LotArea', 'YearBuilt', '1stFlrSF', '2ndFlrSF', 'FullBath', 'BedroomAbvGr', 'TotRmsAbvGrd']

# Select data corresponding to features in feature_names
X = home_data[feature_names]

# Check your answer
step_2.check()
Review Data
Before building a model, take a quick look at X to verify it looks sensible
# Review data
# print description or statistics from X
#print(_)

# print the top few lines
#print(_)
정답
# Review data
# print description or statistics from X
print(X.describe())

# print the top few lines
print(X.head())
Step 3: Specify and Fit Model
Create a DecisionTreeRegressor and save it iowa_model. Ensure you’ve done the relevant import from sklearn to run this command.
Then fit the model you just created using the data in X and y that you saved above.
# from _ import _
#specify the model.
#For model reproducibility, set a numeric value for random_state when specifying the model
iowa_model = ____

# Fit the model
____

# Check your answer
step_3.check()
정답
from sklearn.tree import DecisionTreeRegressor
#specify the model.
#For model reproducibility, set a numeric value for random_state when specifying the model
iowa_model = DecisionTreeRegressor(random_state=1)

# Fit the model
iowa_model.fit(X, y)

# Check your answer
step_3.check()
Step 4: Make Predictions
Make predictions with the model’s predict command using X as the data. Save the results to a variable called predictions.
predictions = ____
print(predictions)

# Check your answer
step_4.check()
정답
predictions = iowa_model.predict(X)
print(predictions)

# Check your answer
step_4.check()
out:
[208500. 181500. 223500. ... 266500. 142125. 147500.]
Think About Your Results
Use the head method to compare the top few predictions to the actual home values (in y) for those same homes. Anything surprising?
이 부분은 문제가 아니니 결과를 한 번 살펴보겠다. head()를 통해 predict를 하면 다음과 같이 나온다.
predictions = iowa_model.predict(X.head())
print(predictions)
out:
[208500. 181500. 223500. 140000. 250000.]